



NDX and SOXX proved resilient as expected. See charts below. Both SOXX and NDX need to break support before we can expect more downside.
Loading...
NDX and SOXX proved resilient as expected. See charts below. Both SOXX and NDX need to break support before we can expect more downside.
And this provides a rather attractive opportunity for equity bulls to buy the dips, as SOXX is sitting right on key support. Similar to NVDA late last year and early this year, key levels in bellwether stocks and bellwether sectors often take several attempts to break. Set your stops before you enter. The eventual breakdown will come.
Trump cares about only four things: 1) the stock market, 2) yields, 3) inflation, 4) and his approval ratings.
Historically, he has reacted most aggressively to yields. With yields already here, he is more incentivized than ever to pull another TACO. I would refer back to the NDX and SOXX charts I shared yesterday, along with the yield charts above. Ideally, we want decisive weekly breaks across all of them.
NDX rebounded alongside SOXX after SOXX tagged key support intraday View noteView note. Then the U.S. escalated by revoking Iran's oil waiver, which is a breach of the MOU. Oil surged in response and equities dumped.
NDX closed below key support today, as shown in the chart below. It needs to reclaim that level in the next few sessions. Otherwise, this could be the beginning of the end.
NVDA defended the support i flagged here: View note
CL1! and BZ1! are catching bids as expected. If they hold above 70 for a few sessions, I expect a move toward the low 80s in the coming weeks.
SOXX must bounce here. Otherwise, it can get ugly very quickly.
NVDA is sitting on 190-196 support. A confirmed break below 190-196 opens the door to a retest of 167.
Tick Tock... Tick Tock...
BTC1!
I told you so
View note
Strategy has sold 3,588 $BTC for $216 million to fund dividends on our Digital Credit securities. As of 7/5/2026, we hodl ₿843,775 in our BTC Reserves and $2.55 billion in our USD Reserves. https://www.strategy.com/press/strategy-sells-3-588-btc-to-fund-digital-credit-dividends-now-holds-843-775-and-2-55b
Chart: Binance BTCUSDT perpetual · Asset Tag: CME Bitcoin futures (BTC1!).
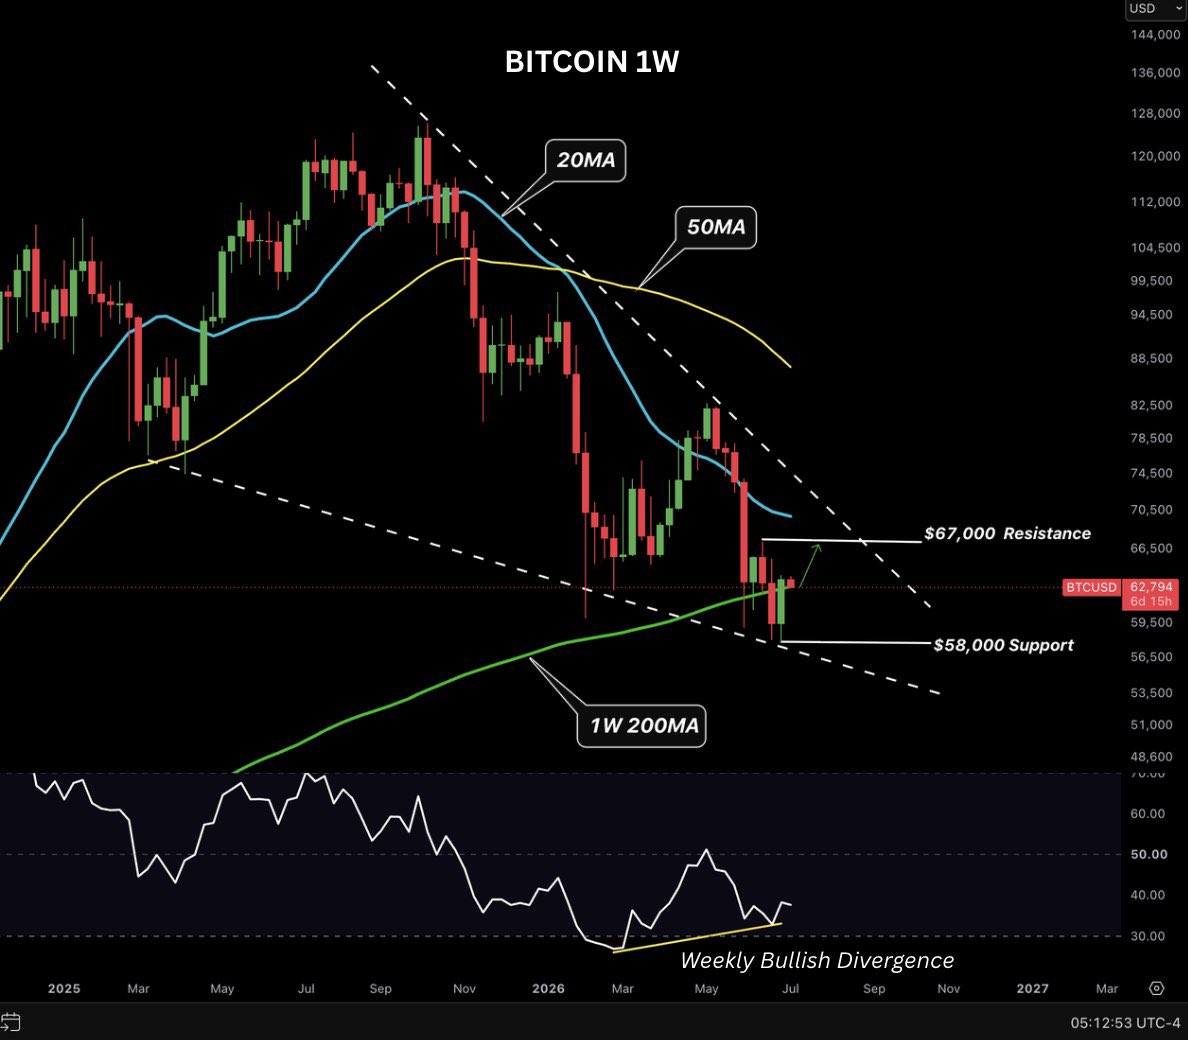
Bitcoin Weekly Analysis
Bitcoin jumped +7% this week and reclaimed the 200-week moving average, a positive sign after briefly falling below it.
Bullish factors:
- Reclaimed the 200-week MA
- Bullish RSI divergence is forming
- US economy remains strong
- ISM near 54 (4-year high) + Russell 2000 at all-time highs
- Lower geopolitical risk as US-Iran peace talks progressBearish factors:
- 4 year cycle suggests new low in Q4
- Still below the 20-week and 50-week MAs
- Weekly Death Cross is still activeKey Levels to watch:
Support: $58K
Resistance: $67K and $83KBottom Line:
Bitcoin is showing early signs of recovery, but it still needs to break above $67K to confirm a stronger trend reversal.
BTC1!
I told you so
#Bitcoin #BTC https://x.com/RealSean_G/status/2073834658245304495
XAUUSD Gold bounced from our 3.9K-4K support and is trying to stabilize. As long as 4K holds, downside pressure is contained and gold can push back toward 4.4K. A sustained close above 4.4K opens the door to a larger rebound. Lose 3.9K-4K, the next major support sits around 3.7K, followed by 3.4K.
VIX Volatility is trying to wake up, but it has not broken the structure yet. 14.2 remains the line in the sand on the downside. As long as VIX (Cboe Volatility Index) holds above that level, volatility compression has limits. A move back above 21.6 would be the first real warning that the tape is starting to price stress again. Above 21.6, the door opens to 28.3.
USDJPY fell back to our 160.8 support on Thursday after suspected MOF intervention showed up in the tape during Asia hours. It was then hit again by weak nonfarm payrolls, which added another leg of pressure on the dollar. I have warned before that the probability of intervention rises once USDJPY breaks above 160. That remains the line in the sand. As long as 160.8 holds, the broader uptrend remains intact, with price still above the rising trendline.
Japan needs three things to cap yen depreciation: lower crude prices, lower oil-product prices, and BOJ hikes. Crude has fallen back to pre-war levels, but oil-product prices remain elevated and the BOJ hiking magnitude is still not enough.
A sustained break below 160.8 opens the door to a retest of the rising trendline.
XAGUSD This chart gives a more granular view on the downside path. If the ascending trendline fails, $53-$52 is the next key support, with generational support at $48 as the next line in the sand if that breaks.
XAGUSD Silver bounced from the rising support line near $56 and is trying to stabilize after the June selloff.
06181.HK has one of the ugliest charts in HK equities. Price is still capped by the descending trendline. 6181 needs to clear that line before there is any real upside to chase. That break would likely be accompanied by gold breaking above 4.4K.
I called the SPX top around 7.6K. It reversed sharply, then found a bottom as NDX hit 28.6K, where I called for a rebound.
NDX is showing relative weakness this week, led by semis. Bellwether names, sectors, and indices typically lead the market into corrections, the same way they lead the market into bull runs.
I also called the ES1! bounce from 7.35K to 7.6K. On Thursday, ES came within 6 handles of that target before reversing more than 100 handles lower the same day. 7.61K-7.62K remains the key resistance on the upside, followed by the major ascending resistance line. On the downside, 7.36K remains key support, followed by 7.14K.
EWY
US30Y bounced hard after testing the rising trendline and is now back near 5% resistance. A sustained close above 5% reopens the path toward the prior highs. If 5% rejects again, the risk is another pullback toward the rising trendline.
Z1! As long as FTSE (FTSE 100) stays above the rising trendline, the path of least resistance remains higher. A sustained break back below that line would put the breakout at risk and open the door to a retest of 10,474.
CL1! Crude has now round-tripped the geopolitical spike. Brent and WTI are both pressing the lower end of the descending channel, so this is where a relief bounce can start, but it is not guaranteed.
The bigger structure is still lower highs unless price can get back above the channel midpoint. The first test sits around 80. Until crude gets back above that level, the bounce is tactical, not a trend change.
BZ1! Crude has now round-tripped the geopolitical spike. Brent and WTI are both pressing the lower end of the descending channel, so this is where a relief bounce can start, but it is not guaranteed.
The bigger structure is still lower highs unless price can get back above the channel midpoint. The first test sits around 80.
DJIRUT and DJI are showing relative strength as we expected from last week.
Meridian is a financial research, information, and publishing service. Meridian is not registered or licensed as an investment adviser, broker or dealer, commodity trading adviser, portfolio manager, exchange, trading venue, or custodian. The Service does not execute trades for you, accept or transmit your orders, hold or safeguard your assets, exercise discretion over your portfolio, connect to or control your brokerage, exchange, wallet, or other financial account, operate a trading venue, or automatically place, mirror, or copy trades. Any position, transaction, order, allocation, portfolio, or Performance shown or described through the Service is hypothetical, simulated, or model-based Financial Content. It does not represent, and need not correspond to, trading, holdings, or results in any actual account. Any price, rate, yield, spread, level, valuation, size, timestamp, target, stop, entry, exit, or other value displayed, recorded, calculated, or referenced in Financial Content may be indicative, modeled, estimated, historical, delayed, composite, closing, settlement, evaluated, or derived. It is not a firm bid, offer, or quote as to price or size and is not evidence that any transaction was executed. All such Performance is hypothetical, simulated, or model-based. It does not represent trading in a funded account, the performance of an actual customer or Meridian account, an audited record, or results achieved by any user. Hypothetical, simulated, backtested, and model-based results have inherent limitations and do not represent or guarantee future results. Any compounded, cumulative, indexed, or otherwise aggregated Performance is a mathematical calculation based on Meridian’s methodology and assumptions. It does not represent portfolio performance and may not reflect position sizing, capital allocation, notional exposure, instrument multipliers, overlapping positions, cash flows, leverage, or capital constraints. Meridian Parties may directly or indirectly hold, acquire, dispose of, or otherwise transact in an issuer, asset, instrument, or related instrument discussed in Financial Content. A Meridian Party’s trading or position need not align with any Financial Content or another Meridian Party’s position or view. Financial Content is general and impersonal information for an audience. It is not individualized investment advice. See Financial Content and Related Risks in the Terms.